The CIE 1931 color spaces are the first defined quantitative links between distributions of wavelengths in the electromagnetic visible spectrum, and physiologically perceived colors in human color vision. The mathematical relationships that define these color spaces are essential tools for color management, important when dealing with color inks, illuminated displays, and recording devices such as digital cameras. The system was designed in 1931 by the “Commission Internationale de l’éclairage”, known in English as the International Commission on Illumination.
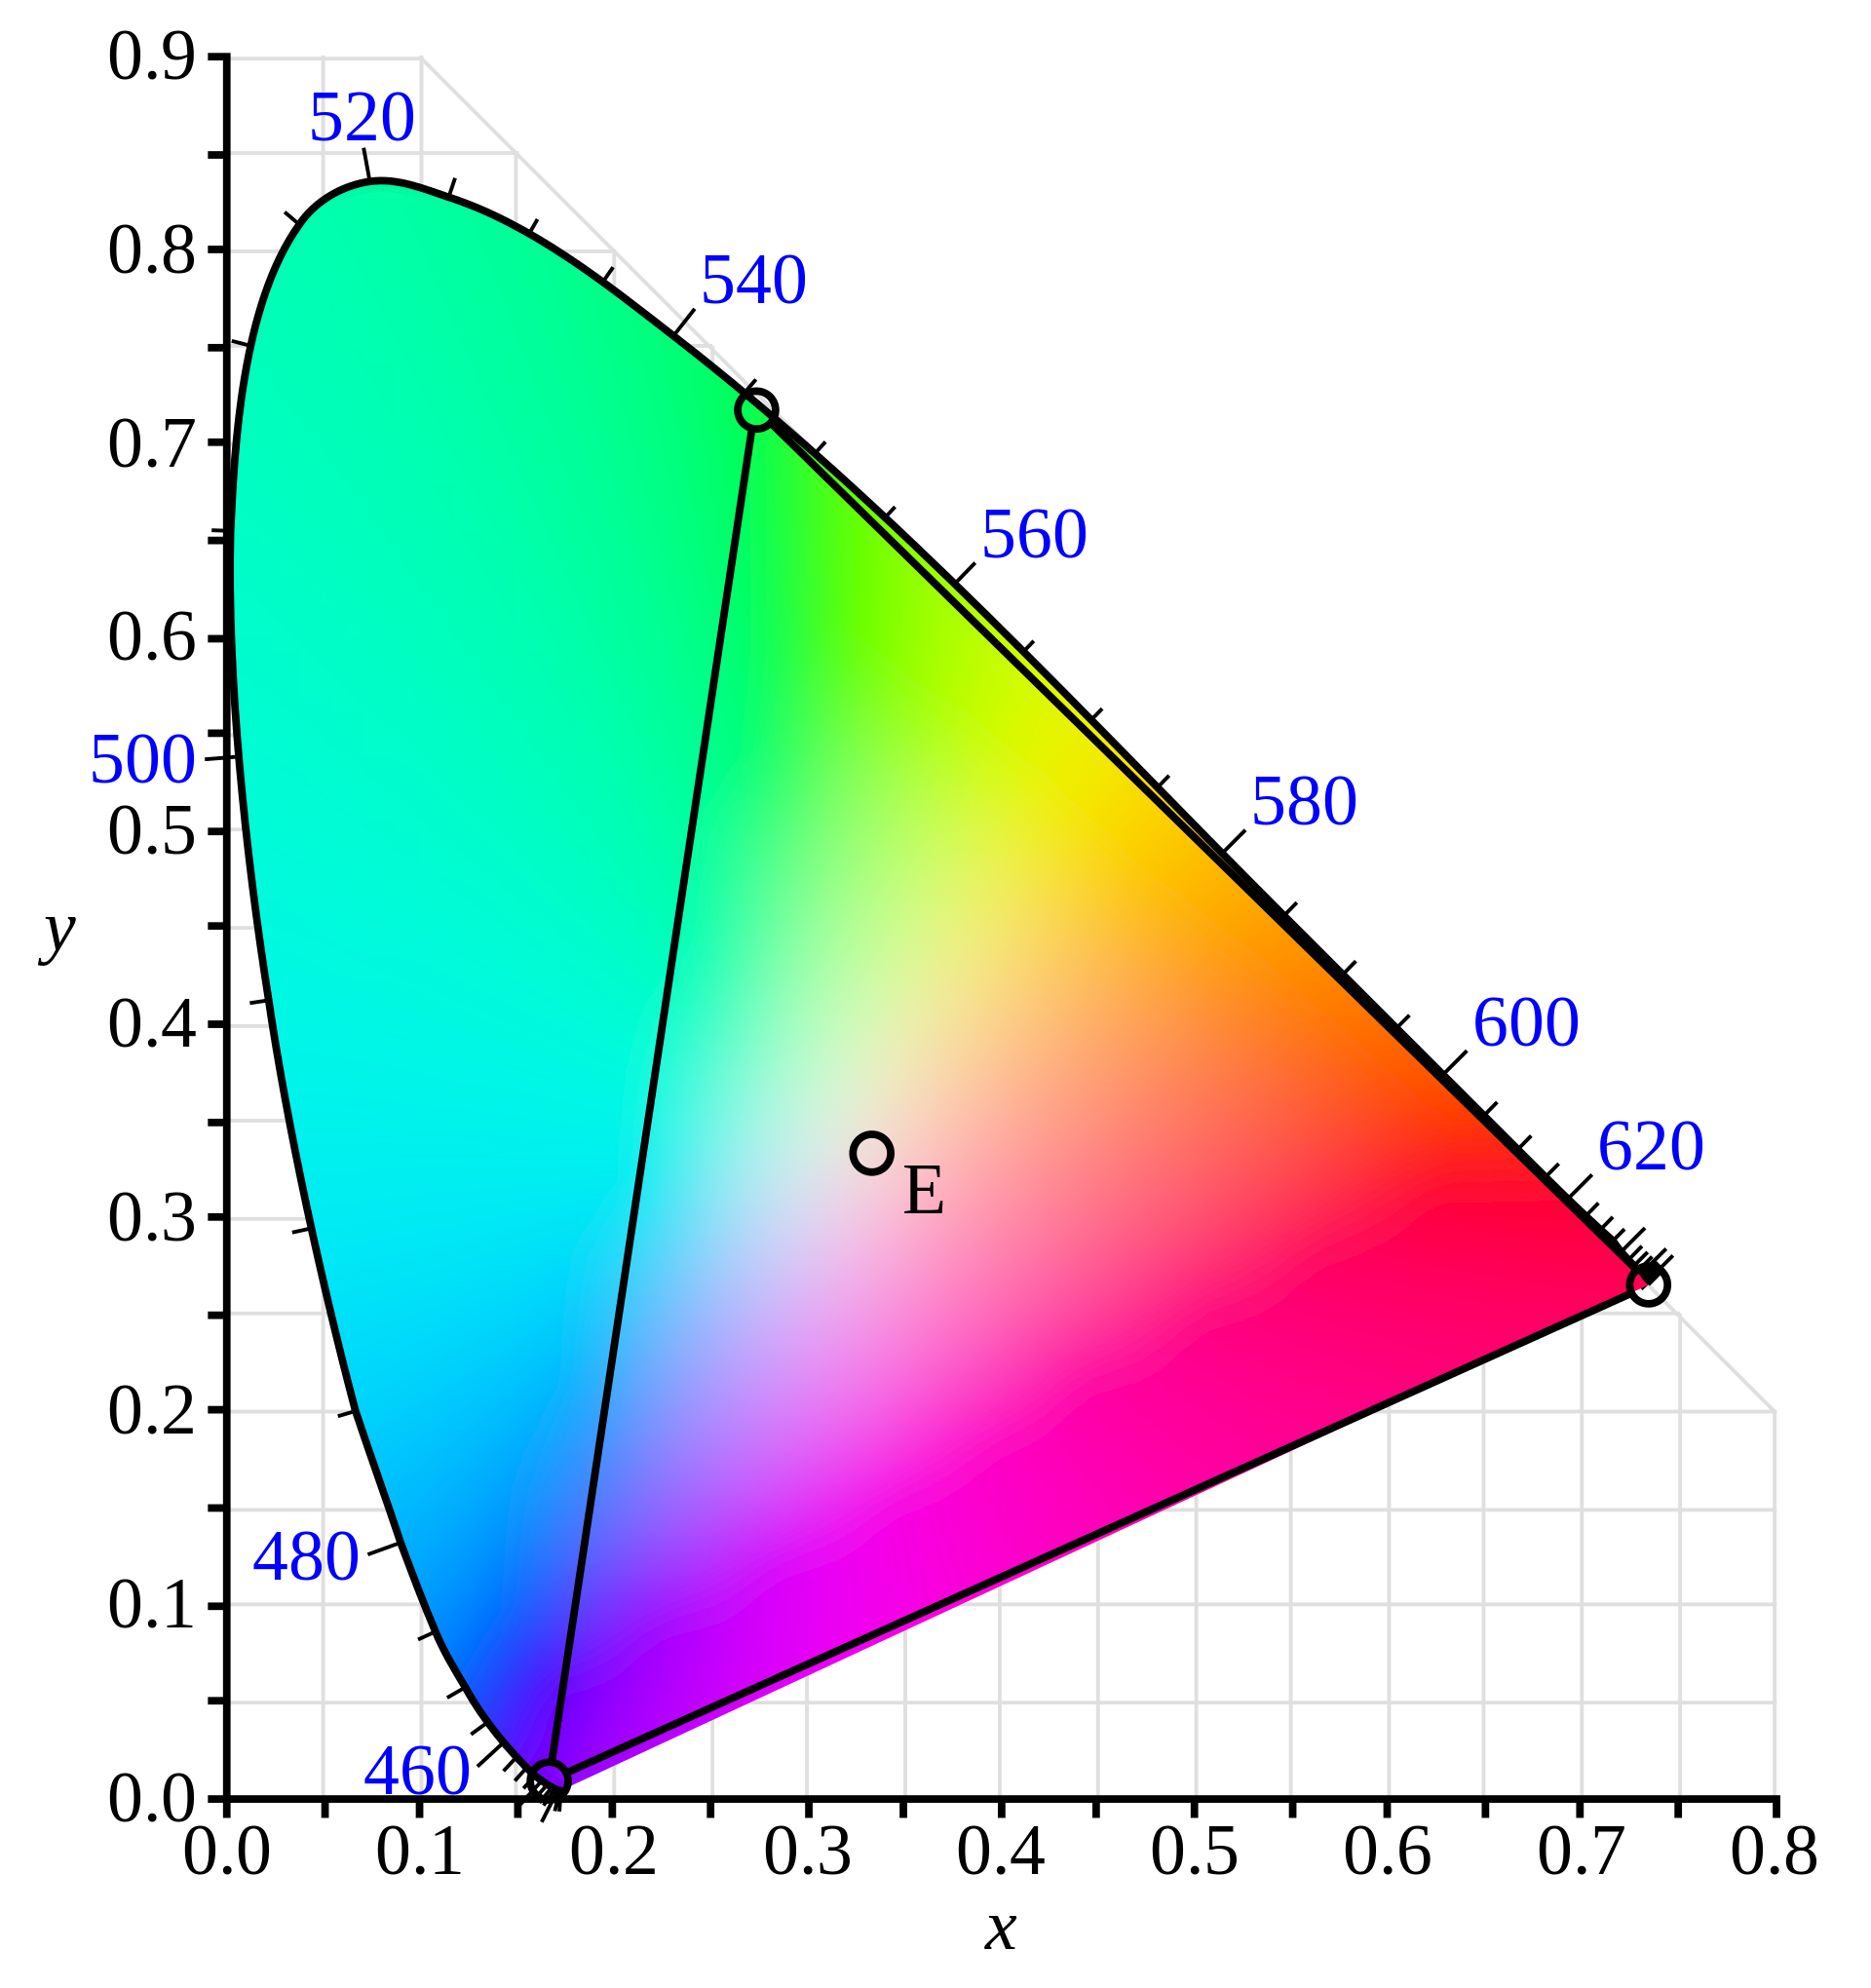
Gamut of the CIE RGB primaries and location of primaries on the CIE 1931 xy chromaticity diagram.
CIE 1931 RGB color space & CIE 1931 XYZ color space
The CIE 1931 RGB color space and CIE 1931 XYZ color space were created by the International Commission on Illumination (CIE) in 1931. They resulted from a series of experiments done in the late 1920s by William David Wright using ten observers and John Guild using seven observers. The experimental results were combined into the specification of the CIE RGB color space, from which the CIE XYZ color space was derived.
The CIE 1931 color spaces are still widely used, as is the 1976 CIELUV color space.
The human eye with normal vision & LMS color space
The human eye with normal vision has three kinds of cone cells that sense light, having peaks of spectral sensitivity in short (“S”, 420 nm – 440 nm), medium (“M”, 530 nm – 540 nm), and long (“L”, 560 nm – 580 nm) wavelengths. These cone cells underlie human color perception in conditions of medium and high brightness; in very dim light color vision diminishes, and the low-brightness, monochromatic “night vision” receptors, denominated “rod cells”, become effective. Thus, three parameters corresponding to levels of stimulus of the three kinds of cone cells, in principle describe any human color sensation. Weighting a total light power spectrum by the individual spectral sensitivities of the three kinds of cone cells renders three effective values of stimulus; these three values compose a tristimulus specification of the objective color of the light spectrum. The three parameters, denoted “S”, “M”, and “L”, are indicated using a 3-dimensional space denominated the “LMS color space”, which is one of many color spaces devised to quantify human color vision.
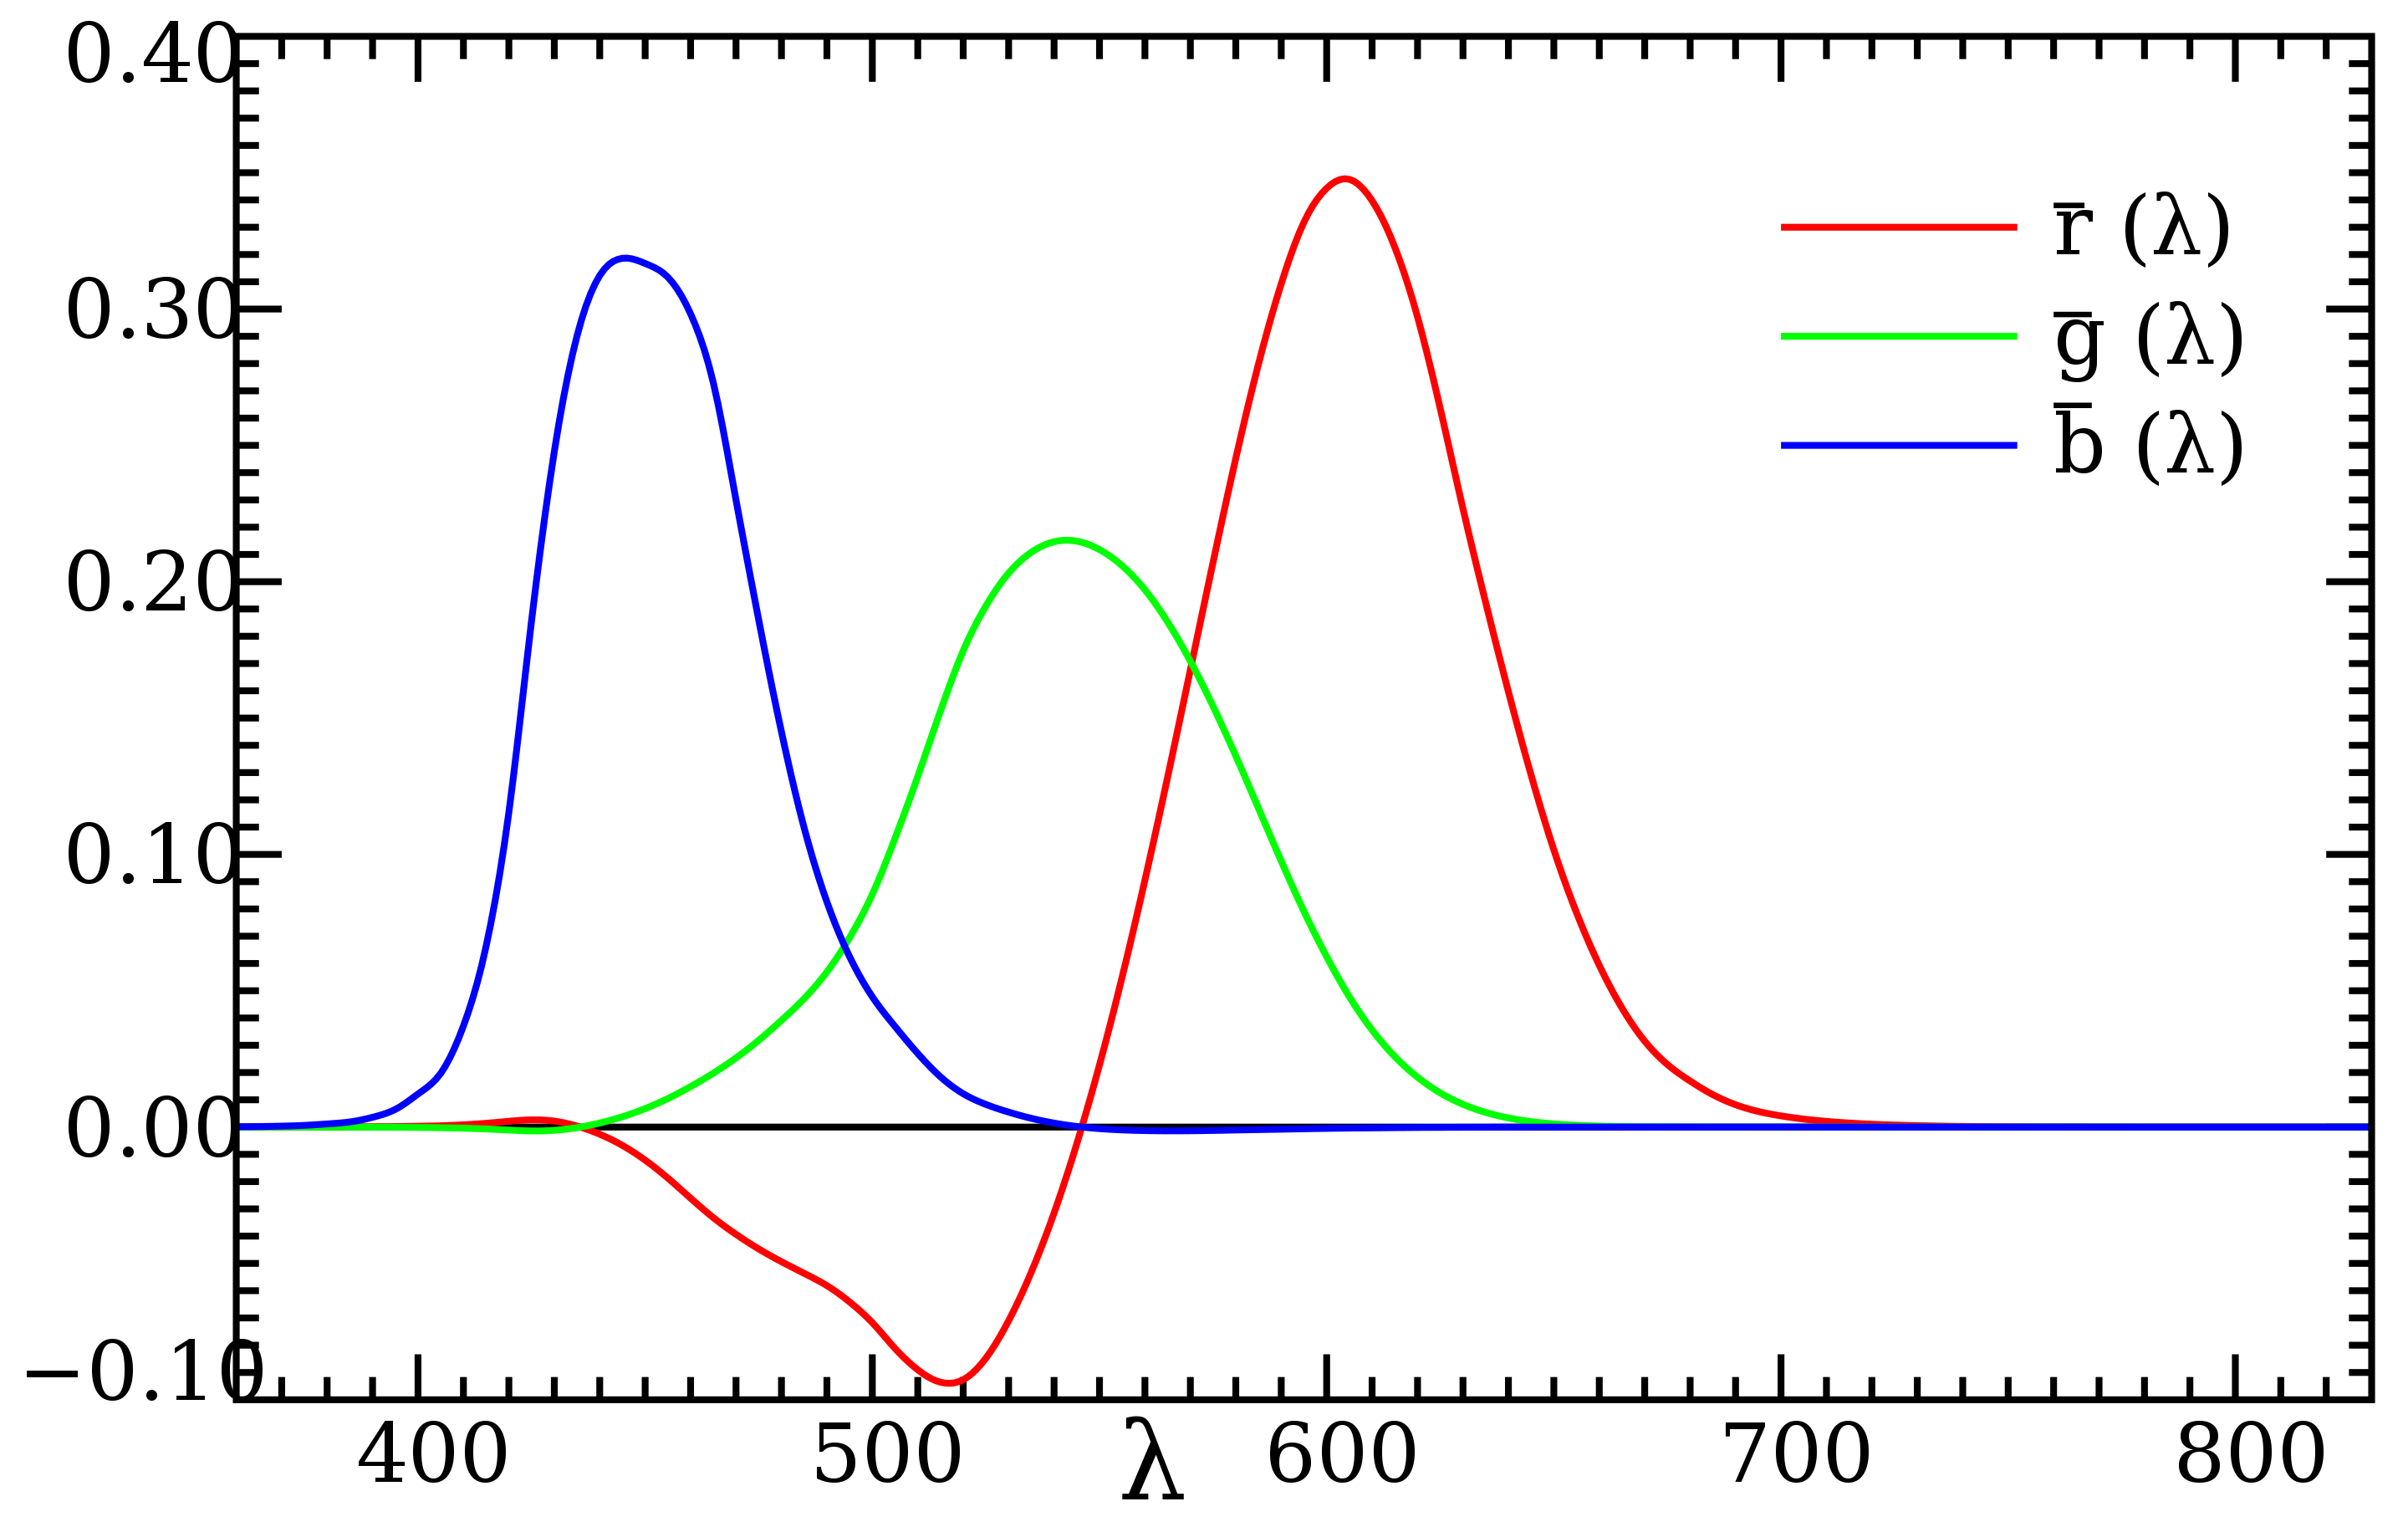
The CIE 1931 RGB color matching functions normalized to equal areas under the curves. Multiplying the red and green curves by 72.0962 and 1.3791 respectively yields the actual color matching functions. The color matching functions are proportional to the intensities of primaries needed to match the monochromatic test color at the wavelength shown on the horizontal scale.
Color Vision
Color vision, a feature of visual perception, is an ability to perceive differences between light composed of different frequencies independently of light intensity.
Color perception is a part of the larger visual system and is mediated by a complex process between neurons that begins with differential stimulation of different types of photoreceptors by light entering the eye. Those photoreceptors then emit outputs that are propagated through many layers of neurons and then ultimately to the brain. Color vision is found in many animals and is mediated by similar underlying mechanisms with common types of biological molecules and a complex history of evolution in different animal taxa. In primates, color vision may have evolved under selective pressure for a variety of visual tasks including the foraging for nutritious young leaves, ripe fruit, and flowers, as well as detecting predator camouflage and emotional states in other primates.
Color Sapce
A color space maps a range of physically produced colors from mixed light, pigments, etc. to an objective description of color sensations registered in the human eye, typically in terms of tristimulus values, but not usually in the LMS color space defined by the spectral sensitivities of the cone cells. The tristimulus values associated with a color space can be conceptualized as amounts of three primary colors in a tri-chromatic, additive color model. In some color spaces, including the LMS and XYZ spaces, the primary colors used are not real colors in the sense that they cannot be generated in any light spectrum.
The CIE XYZ color space encompasses all color sensations that are visible to a person with average eyesight. That is why CIE XYZ (Tristimulus values) is a device-invariant representation of color. It serves as a standard reference against which many other color spaces are defined. A set of color-matching functions, like the spectral sensitivity curves of the LMS color space, but not restricted to non-negative sensitivities, associates physically produced light spectra with specific tristimulus values.
Consider two light sources composed of different mixtures of various wavelengths. Such light sources may appear to be the same color; this effect is called “metamerism.” Such light sources have the same apparent color to an observer when they produce the same tristimulus values, regardless of the spectral power distributions of the sources.
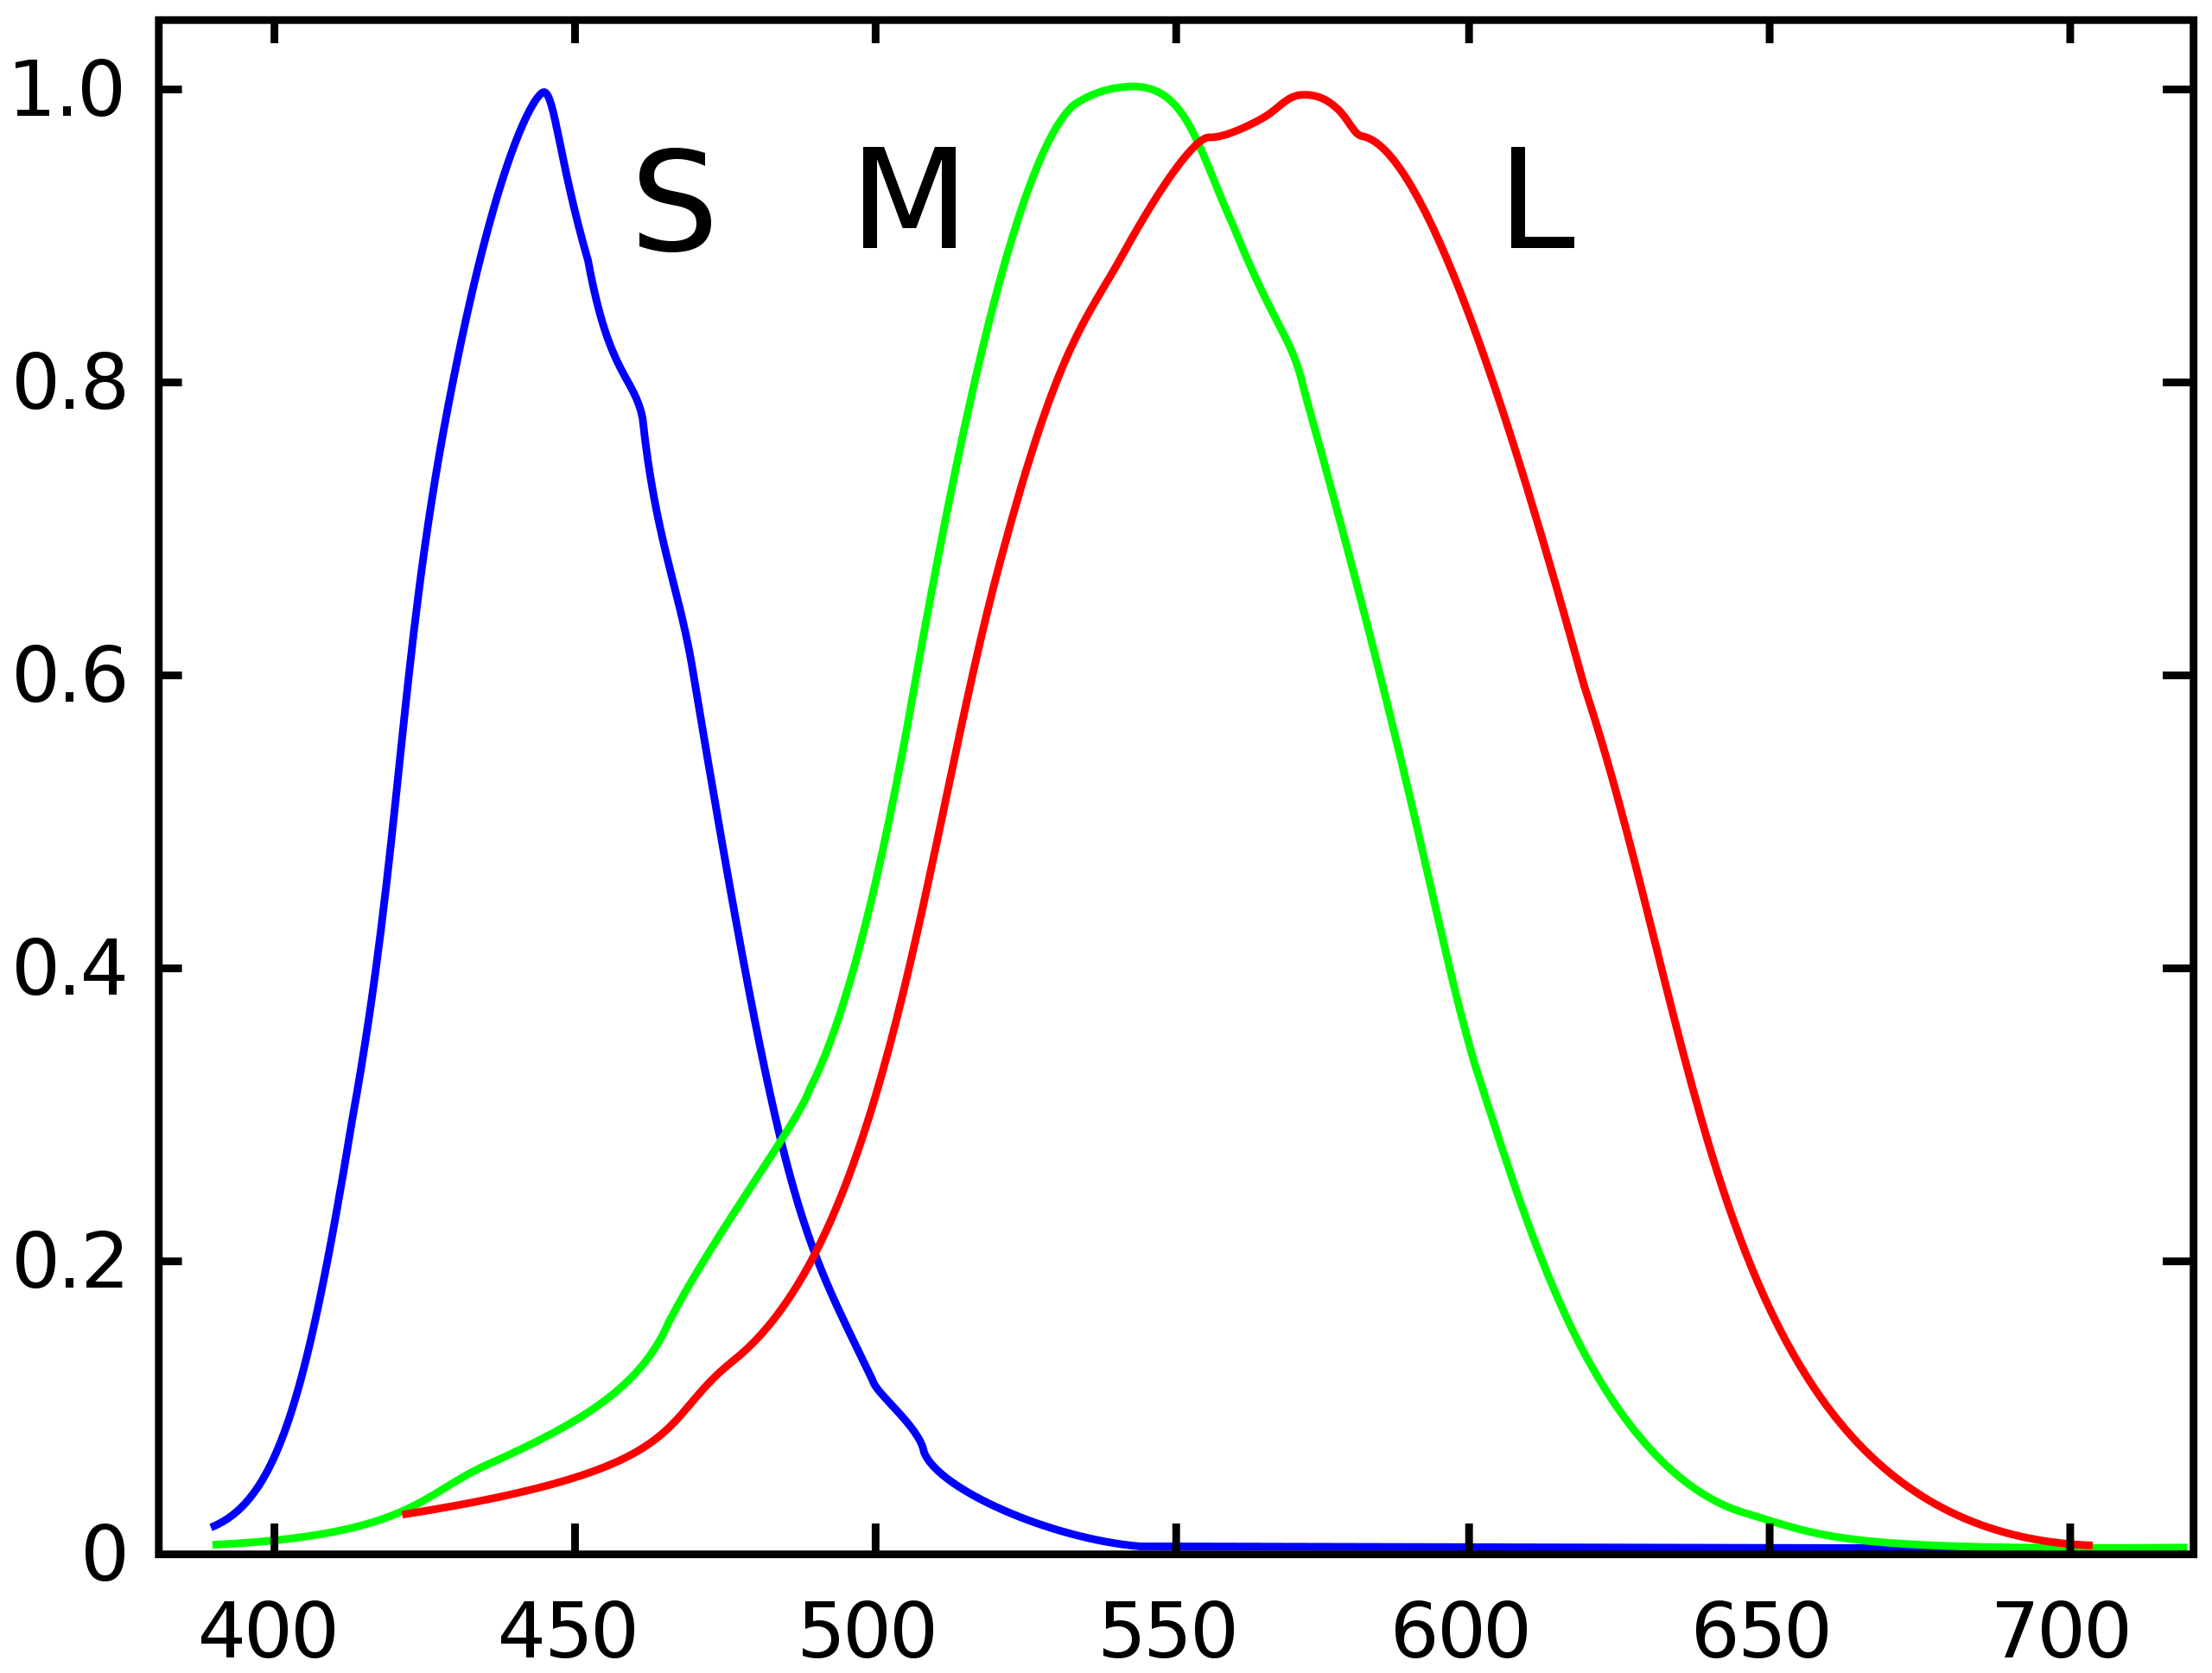
The normalized spectral sensitivity of human cone cells of short-, middle- and long-wavelength types.
Most wavelengths stimulate two or all three kinds of cone cell because the spectral sensitivity curves of the three kinds overlap. Certain tristimulus values are thus physically impossible: e.g. LMS tristimulus values that are non-zero for the M component and zero for both the L and S components. Furthermore pure spectral colors would, in any normal trichromatic additive color space, e.g., the RGB color spaces, imply negative values for at least one of the three primaries because the chromaticity would be outside the color triangle defined by the primary colors. To avoid these negative RGB values, and to have one component that describes the perceived brightness, “imaginary” primary colors and corresponding color-matching functions were formulated. The CIE 1931 color space defines the resulting tristimulus values, in which they are denoted by “X”, “Y”, and “Z”. In XYZ space, all combinations of non-negative coordinates are meaningful, but many, such as the primary locations [1, 0, 0], [0, 1, 0], and [0, 0, 1], correspond to imaginary colors outside the space of possible LMS coordinates; imaginary colors do not correspond to any spectral distribution of wavelengths and therefore have no physical reality.
Meaning of X, Y and Z
In the CIE 1931 model, Y is the luminance, Z is quasi-equal to blue (of CIE RGB), and X is a mix of the three CIE RGB curves chosen to be nonnegative (see § Definition of the CIE XYZ color space). Setting Y as luminance has the useful result that for any given Y value, the XZ plane will contain all possible chromaticities at that luminance.
The unit of the tristimulus values X, Y, and Z is often arbitrarily chosen so that Y = 1 or Y = 100 is the brightest white that a color display supports. In this case, the Y value is known as the relative luminance. The corresponding whitepoint values for X and Z can then be inferred using the standard illuminants.
Since the XYZ values are defined much earlier than the characterization of cone cells in the 1950s (by Ragnar Granit),[7] the physiological meaning of these values are known only much later. The Hunt-Pointer-Estevez matrix from the 1980s relates XYZ with LMS. When inverted, it shows how the three cone responses add up to XYZ functions:

In other words, the Z value is solely made up of the S cone response, the Y value a mix of L and M responses, and X value a mix of all three. This fact makes XYZ values analogous to, but different from, the LMS cone responses of the human eye.
CIE xy chromaticity diagram
The CIE 1931 color space chromaticity diagram. The outer curved boundary is the spectral (or monochromatic) locus, with wavelengths shown in nanometers. The colors your screen displays in this image are specified using sRGB, so the colors outside the sRGB gamut are not displayed properly. Depending on the color space and calibration of your display device, the sRGB colors may not be displayed properly either. This diagram displays the maximally saturated bright colors that can be produced by a computer monitor or television set.
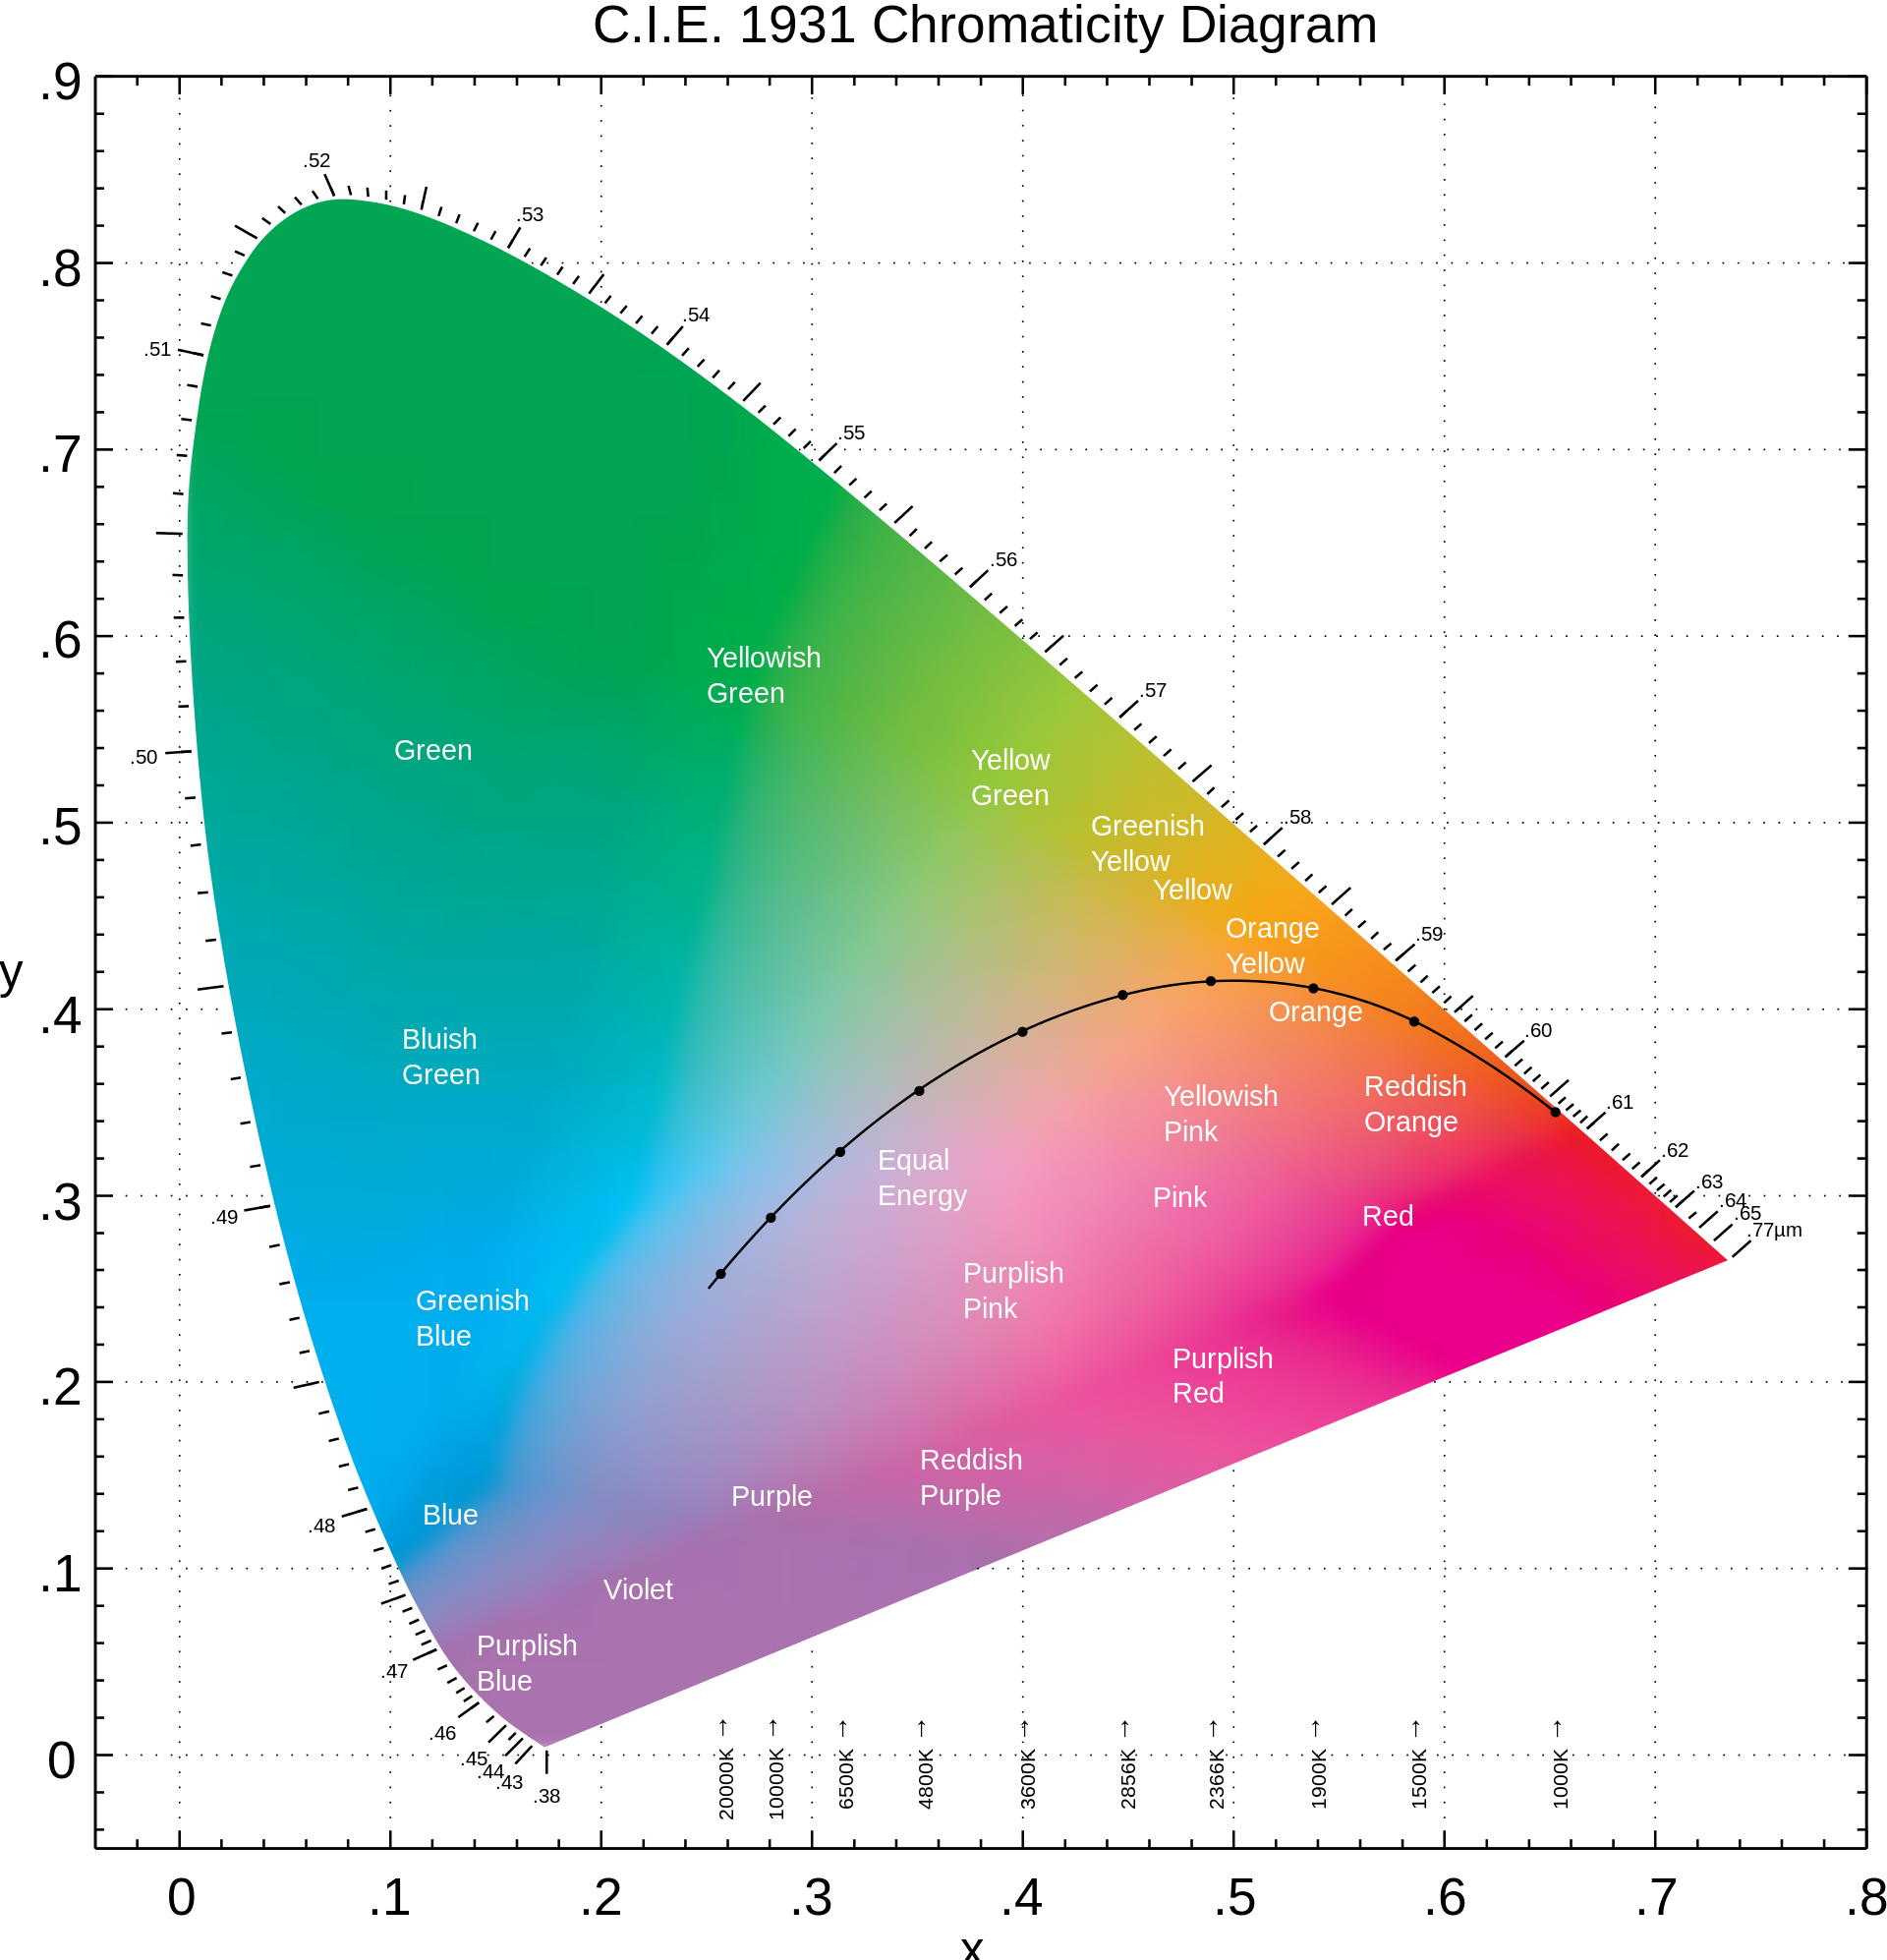
The CIE 1931 color space chromaticity diagram rendered in terms of the colors of lower saturation and value than those displayed in the diagram above that can be produced by pigments, such as those used in printing. The color names are from the Munsell color system. The solid curve with dots on it, through the middle, is the Planckian locus, with the dots corresponding to a few select black-body temperatures that are indicated just above the x-axis.
The chromaticity diagram illustrates a number of interesting properties of the CIE XYZ color space:
- The diagram represents all of the chromaticities visible to the average person. These are shown in color and this region is called the gamut of human vision. The gamut of all visible chromaticities on the CIE plot is the tongue-shaped or horseshoe-shaped figure shown in color. The curved edge of the gamut is called the spectral locus and corresponds to monochromatic light (each point representing a pure hue of a single wavelength), with wavelengths listed in nanometers. The straight edge on the lower part of the gamut is called the line of purples. These colors, although they are on the border of the gamut, have no counterpart in monochromatic light. Less saturated colors appear in the interior of the figure with white at the center.
- It is seen that all visible chromaticities correspond to non-negative values of x, y, and z (and therefore to non-negative values of X, Y, and Z).
- If one chooses any two points of color on the chromaticity diagram, then all the colors that lie in a straight line between the two points can be formed by mixing these two colors. It follows that the gamut of colors must be convex in shape. All colors that can be formed by mixing three sources are found inside the triangle formed by the source points on the chromaticity diagram (and so on for multiple sources).
- An equal mixture of two equally bright colors will not generally lie on the midpoint of that line segment. In more general terms, a distance on the CIE xy chromaticity diagram does not correspond to the degree of difference between two colors. In the early 1940s, David MacAdam studied the nature of visual sensitivity to color differences, and summarized his results in the concept of a MacAdam ellipse. Based on the work of MacAdam, the CIE 1960, CIE 1964, and CIE 1976 color spaces were developed, with the goal of achieving perceptual uniformity (have an equal distance in the color space correspond to equal differences in color). Although they were a distinct improvement over the CIE 1931 system, they were not completely free of distortion.
- It can be seen that, given three real sources, these sources cannot cover the gamut of human vision. Geometrically stated, there are no three points within the gamut that form a triangle that includes the entire gamut; or more simply, the gamut of human vision is not a triangle.
- Light with a flat power spectrum in terms of wavelength (equal power in every 1 nm interval) corresponds to the point (x, y) = (1/3, 1/3).
Definition of CIE XYZ color space
CIE RGB color space
The first step in developing the CIE XYZ color space is the measurement of the CIE RGB color space. The CIE RGB color space is one of many RGB color spaces, distinguished by a particular set of monochromatic (single-wavelength) primary colors.
In the 1920s, two independent experiments on human color perception were conducted by W. David Wright with ten observers, and John Guild with seven observers. Their results laid the foundation for the trichromatic CIE XYZ color space specification.
The experiments were conducted by using a circular split screen (a bipartite field) 2 degrees in diameter, which is the angular size of the human fovea. On one side a test color was projected while on the other an observer-adjustable color was projected. The adjustable color was a mixture of the three monochromatic primary colors, each with adjustable brightness. The observer would alter the brightness of each of the three primary beams until a match to the test color was observed.
If the test color were simply a monochromatic color at wavelength λ, and if it could be matched by a combination of the three primaries at relative intensities, respectively, then a tabulation of these values at various λ will estimate three functions of wavelength. These are the RGB color-matching functions. Any spectral distribution can be thought of as a combination of a number of monochromatic sources at varying intensities, so that (by Grassmann’s laws) integrating the color matching functions with that spectral distribution will yield the intensities of the three primaries necessary to match it. The problem is that the three primaries can only produce colors which lie withinin their gamut - the triangle in color space formed by the primaries, which never touches the monochromatic locus nor the purple line except at the three primaries. In other words, there is no monochromatic source that can be matched by a combination of the three primaries, except at the wavelengths of the three primaries themselves. However, by adding one of the primaries to the monochromatic test color, the test color can be brought into the RGB gamut, allowing a match to be made. Adding a primary to the monochromatic test color is effectively the same as subtracting it from the adjustable color, which of course cannot be done since it is impossible to have a negative intensity for any of the primaries.
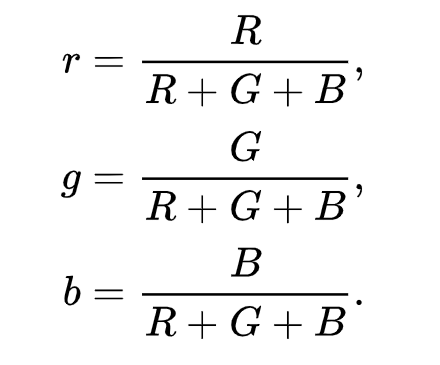
The CIE RGB space can be used to define chromaticity in the usual way: The chromaticity coordinates are r, g and b where:
The numbers in the conversion matrix below are exact, with the number of digits specified in CIE standards.
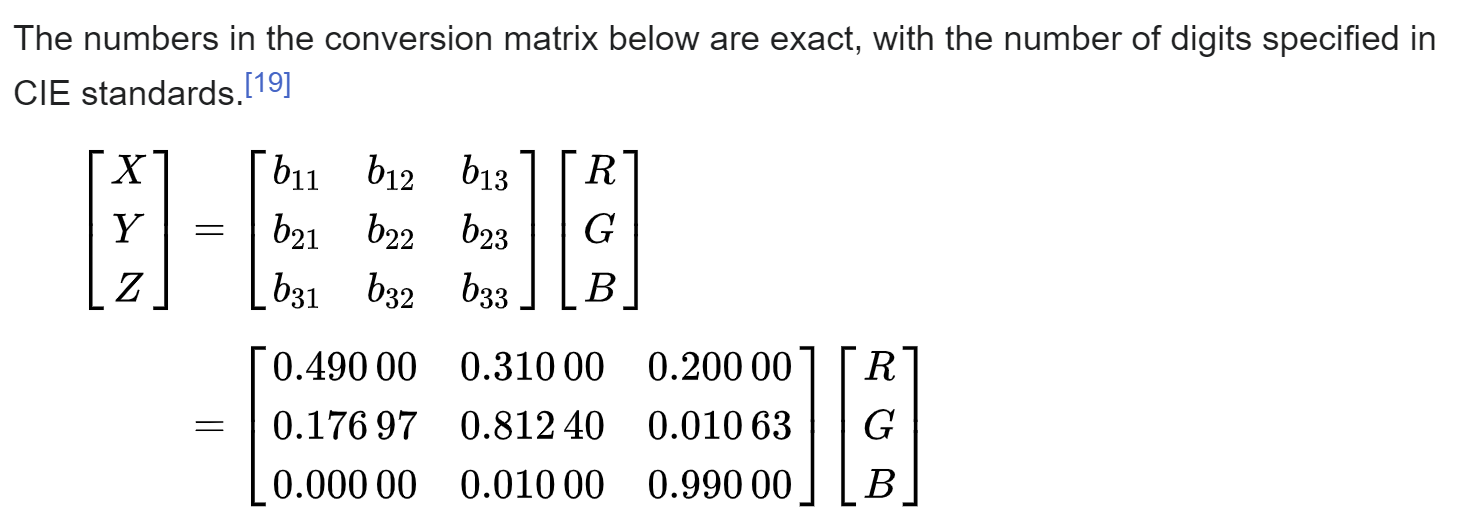
The above matrix is balanced for the equi-energy stimulus: it has coordinates (1,1,1) in both RGB and XYZ coordinates.
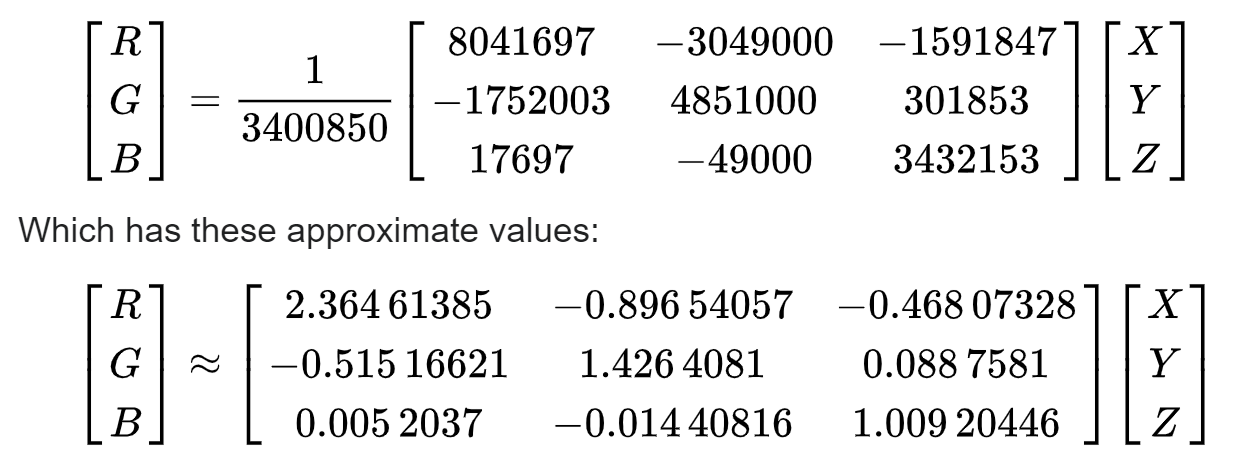
While the above matrix is exactly specified in standards, the inverse is left unspecified so that it can be approximated to machine precision to reduce round-trip rounding errors. Its values can be computed precisely using rational numbers:
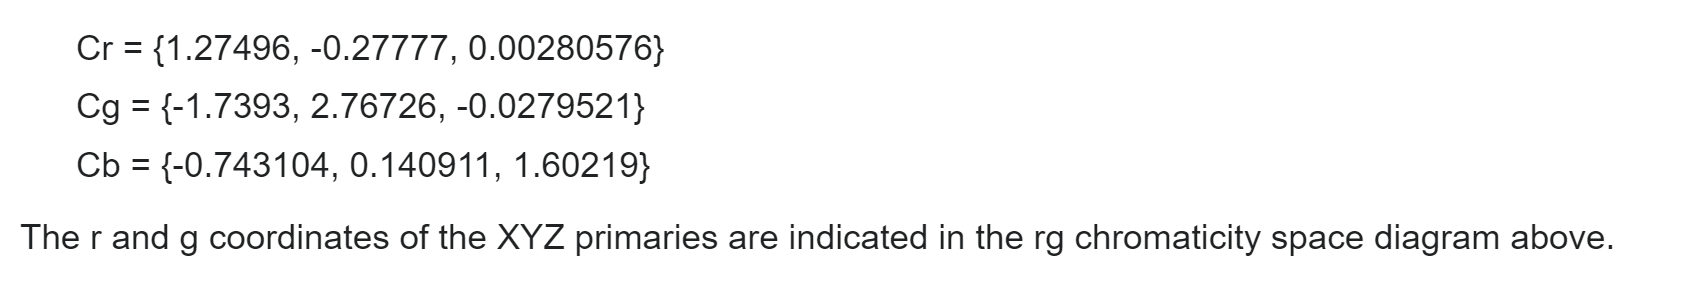
The XYZ primaries will have XYZ coordinates [1,0,0], [0,1,0], and [0,0,1] in XYZ space, so the columns of the inverse matrix above specify the XYZ primaries ( Cr, Cg and Cb) in RGB space. Dividing each column by its sum will give the coordinates of the XYZ primaries in rgb space which yields:
The integrals of the XYZ color matching functions must all be equal by requirement 3 above, and this is set by the integral of the photopic luminous efficiency function by requirement 2 above. The tabulated sensitivity curves have a certain amount of arbitrariness in them. The shapes of the individual X, Y and Z sensitivity curves can be measured with a reasonable accuracy. However, the overall luminosity curve (which in fact is a weighted sum of these three curves) is subjective, since it involves asking a test person whether two light sources have the same brightness, even if they are in completely different colors. Along the same lines, the relative magnitudes of the X, Y, and Z curves are arbitrary. Furthermore, one could define a valid color space with an X sensitivity curve that has twice the amplitude. This new color space would have a different shape. The sensitivity curves in the CIE 1931 and 1964 XYZ color spaces are scaled to have equal areas under the curves.